 uogent®
Analysis / Urban Mobility & Public Transport
Beyond Metro Kilometres: The Next Test for India’s Urban-Mobility Policy
India has proved it can build mass transit quickly. It must now build a sophisticated coordination and orchestration layer that makes metros, buses, streets, shared mobility and land use work towards faster, safer, affordable and accessible journeys.

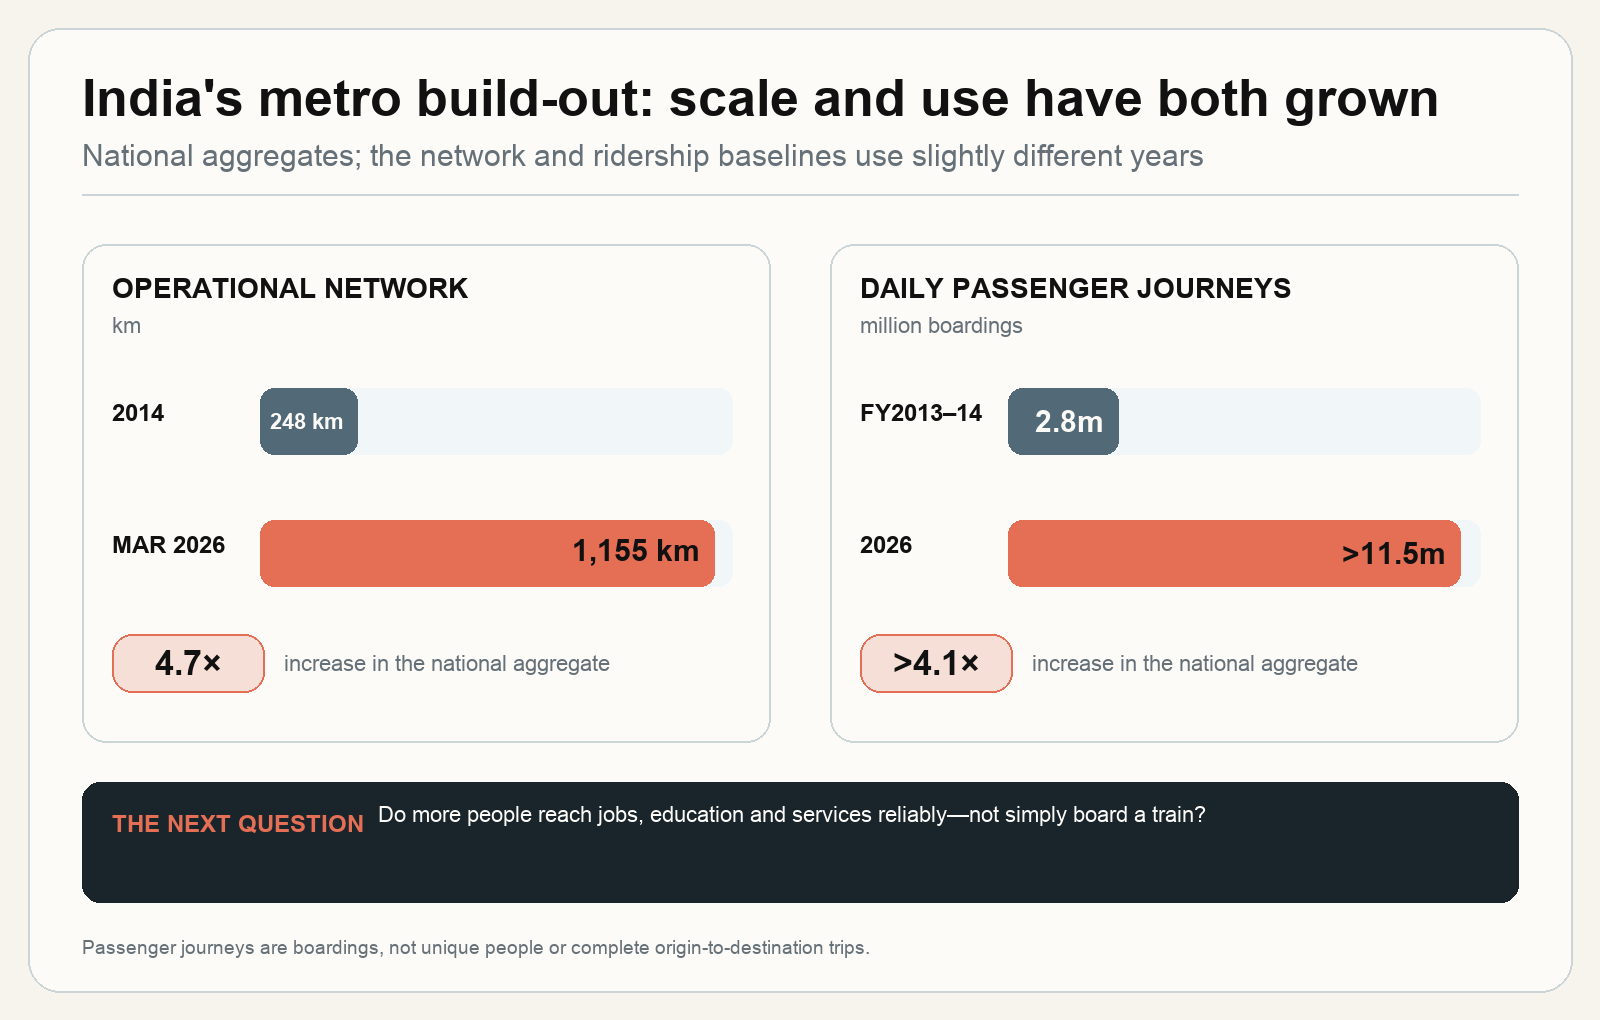
India’s urban-transport build-out is a real achievement. By March 2026, 1,155 kilometres of metro were operational in 26 cities, and daily passenger journeys had risen above 1.15 crore. A decade earlier, the network was 248 kilometres in five cities. India can now design, finance and construct large rail systems at a pace that once looked unlikely.
A kilometre long metro track however, measures only an asset and not a journey. A train can be punctual while the passenger still faces a broken pavement, an unsafe crossing, a twenty-minute wait for a feeder, a costly transfer or a destination with no step-free entrance. A new electric bus can sit in a depot without a charger, or in traffic without a bus lane. A station can raise nearby land values without making housing or jobs easier to reach.
The Economic Survey 2025-26 recognises this shift. It calls for larger and more digital bus fleets, finance-first electric-bus deployment, shared last-mile services, transit-oriented development and value capture around stations. Importantly, it says future urban policy should prioritise system performance over standalone projects.
The construction record is real
The national numbers show both the scale of the build-out and the limits of the usual scorecard. Operational metro length grew about 4.7 times between 2014 and March 2026. Daily passenger journeys grew more than fourfold from the FY2013-14 baseline. Those passenger journeys are boardings, however - not unique people and not complete origin-to-destination trips. A passenger who changes lines or modes may be counted more than once.
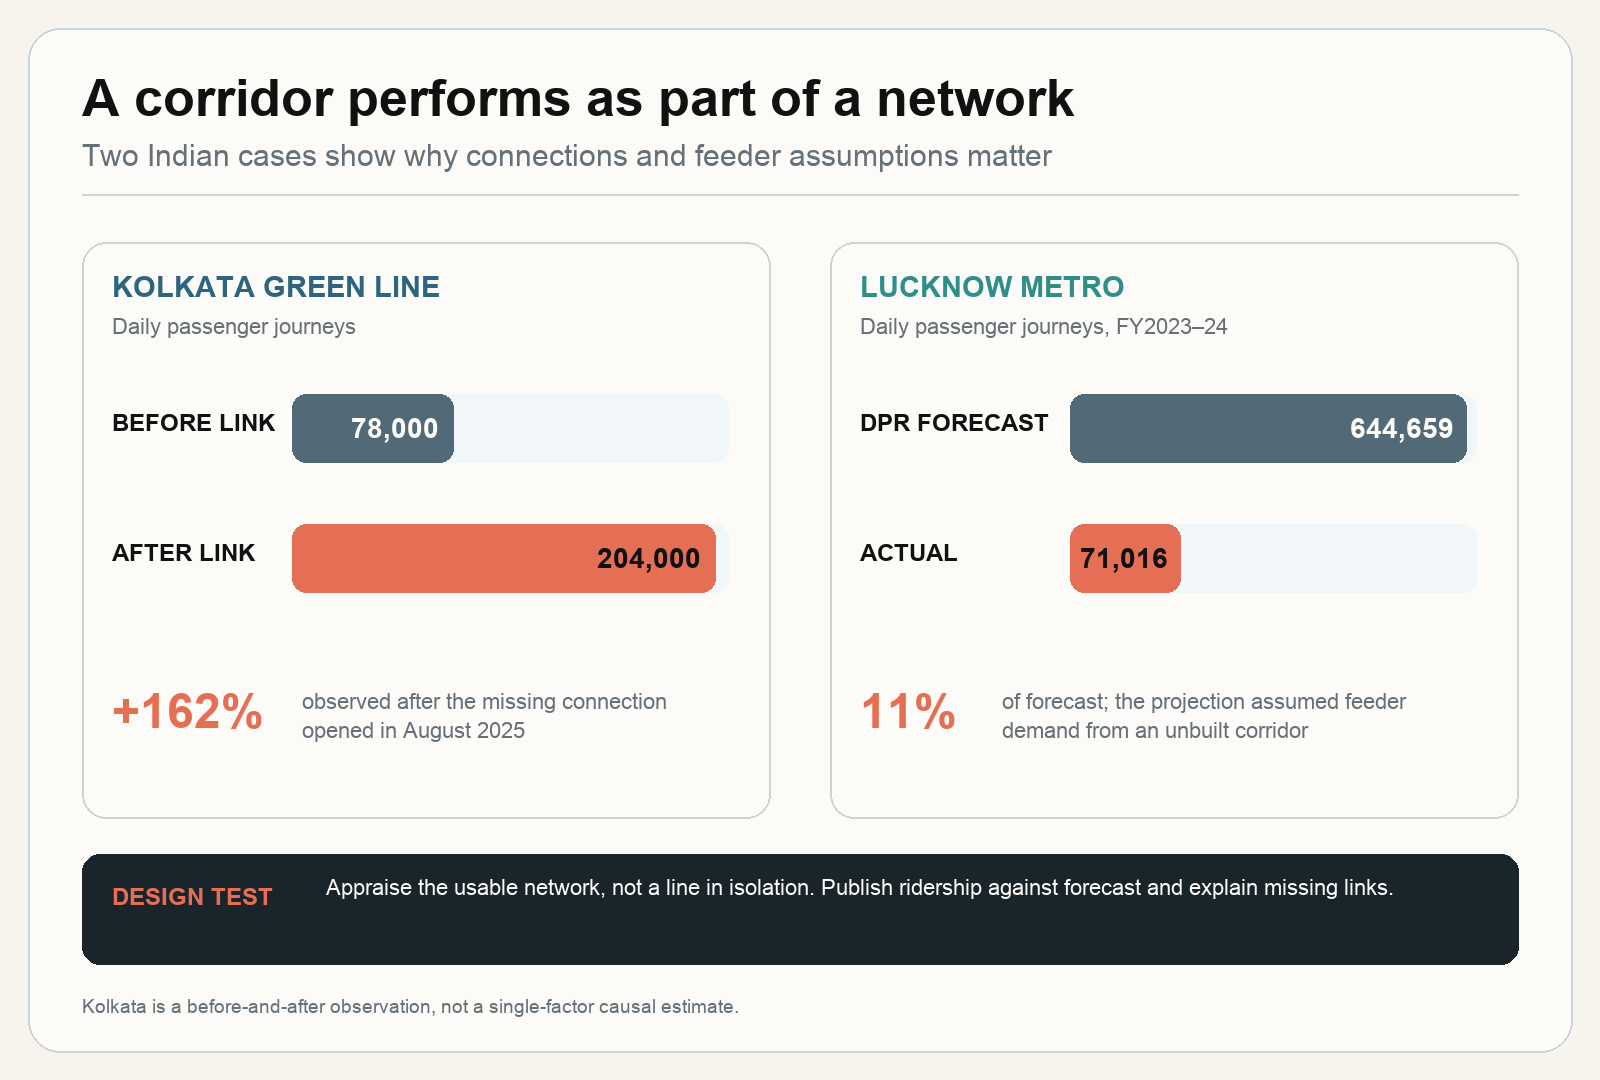
The more revealing question is whether each corridor works as part of the larger network. Kolkata’s Green Line illustrates the upside. After a missing connection was completed in August 2025, daily journeys rose from roughly 78,000 to 2.04 lakh. The timing does not prove that the link alone caused the increase, but it shows how network completion can change the usefulness of an existing asset.
Lucknow shows the opposite risk. A performance audit recorded about 71,000 daily passenger journeys in FY2023-24 against a project-report forecast of roughly 6.45 lakh. The forecast had assumed feeder demand from an East-West corridor that had not been built. An isolated line was being compared with a network that existed only in the model.
Lucknow's case is not an argument against metro investment, but rather a stricter network case before approval and an honest review after opening. Every major proposal should publish the assumed feeder routes, transfer volumes, fares, land-use changes and construction sequence. One, three and five years after service begins, the city should publish ridership against forecast, door-to-door travel-time change, the explanation for any gap and the remedy. The same test should apply when deciding whether the next rupee is better spent on an extension, more frequent service, buses, walking routes or a missing interchange.
A journey is a chain
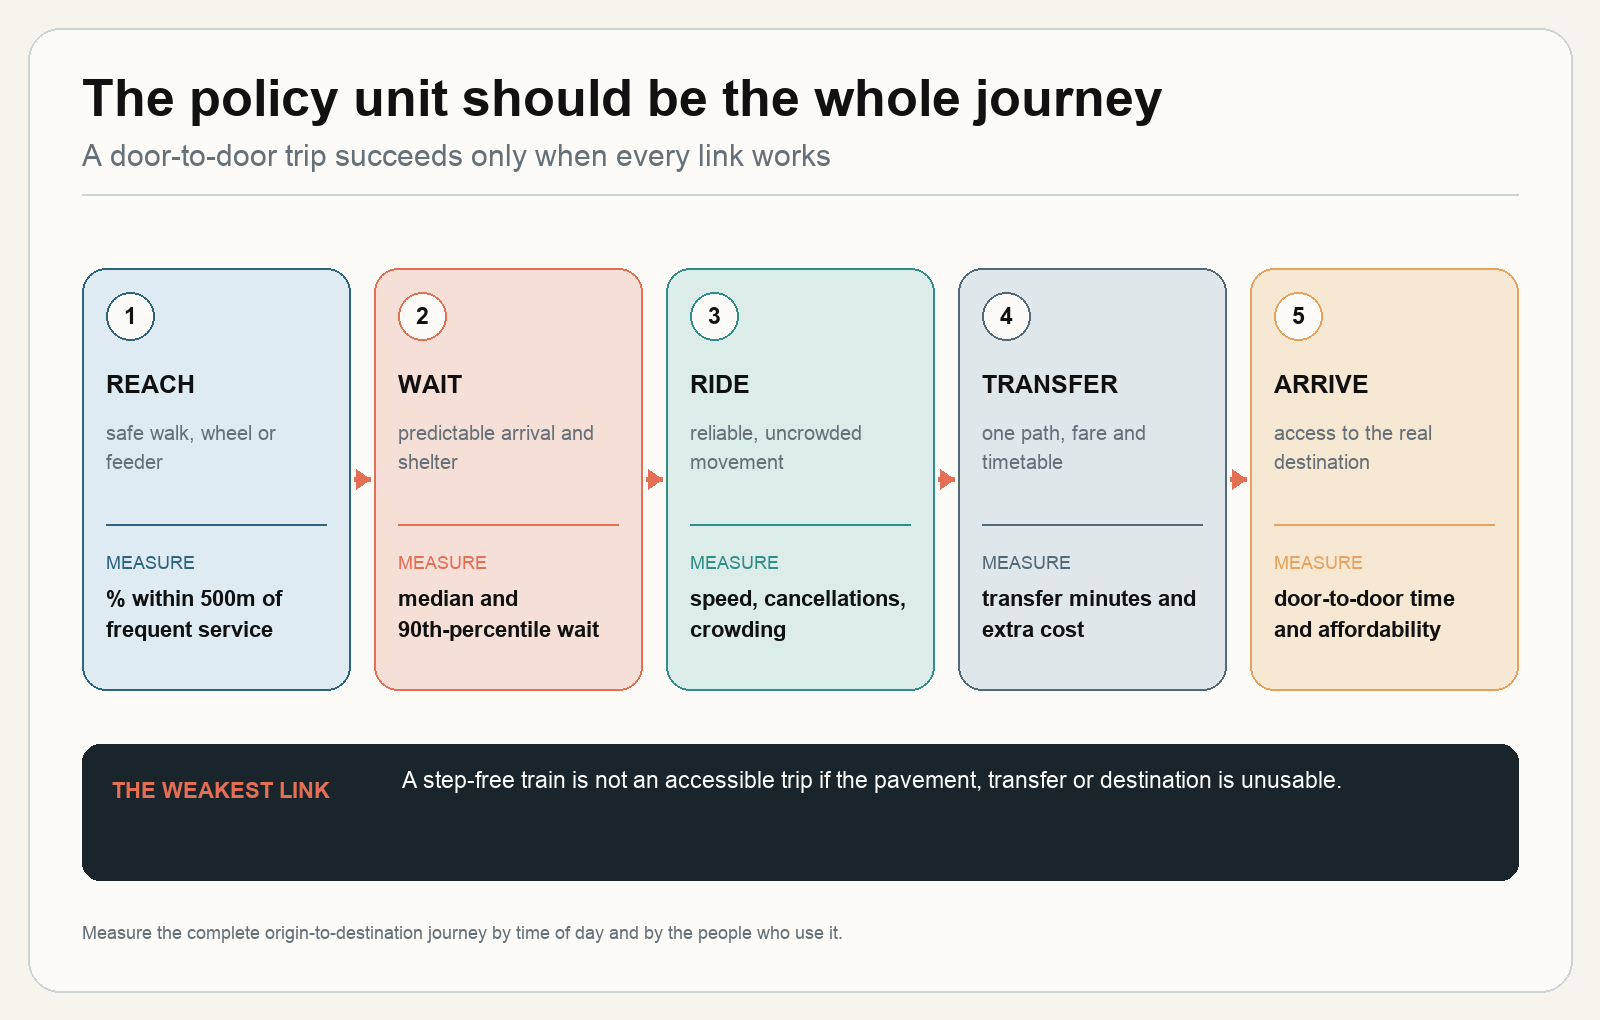
Most passengers do not live or work inside a station. They walk, wheel, cycle, take a shared auto, ride a feeder bus or combine several of those steps. A usable journey therefore has at least five links: reach the network; wait; ride; transfer; and reach the real destination. The weakest link can effectively cancel the value of the others.
Last-mile services should be treated as part of the public network. Shared autos, e-rickshaws, minibuses, bike taxis and on-demand shuttles already solve real access problems. The Economic Survey proposes simpler and more standard permits, designated bays, app and fare integration, open transit data and an ONDC-linked mobility platform. Those ideas should be tested against passenger outcomes: reduced transfer time, predictable prices, safe boarding, accessible vehicles where needed and service into neighbourhoods that fixed-route buses do not reach efficiently.
Integration must not mean excluding small operators or forcing every trip into one company. It means common rules at the points that matter: where vehicles may wait, what safety and insurance standards apply, how a passenger sees the next departure, whether one ticket or discount covers a transfer, and how complaints are resolved. The city should publish service data while protecting personal information and commercially sensitive details.
Accessibility deserves the same end-to-end test. An official February 2025 reply to a parliament question reported more than 42,000 buses as partially accessible, 8,695 as fully accessible and 3,120 of 3,533 bus stations as accessible across the wider bus system. New e-bus specifications have stronger requirements. Yet an accessible vehicle is not the same as an independently usable journey. Cities should test the complete path with disabled passengers - from pavement and stop to interchange and destination - and publish the share of journeys that can actually be completed. Source: PIB accessibility reply.
Affordability is also a whole-trip measure. India does not yet publish a strong, current national series showing urban transport spending as a share of household income. That absence should be fixed. A low base fare can still produce an expensive journey when a passenger pays separately for a feeder and a transfer. A city dashboard should show the total cost of representative trips, monthly spending by income group and how many jobs, schools and clinics are reachable at that cost.
Safety belongs on the same dashboard. Urban areas recorded 54,479 road deaths in 2023 - 31.5% of the national total. This is a street-system result, not a metro statistic, and it covers all road users. It is still central to mobility policy because walking to a station or crossing to a bus stop is part of the journey. Source: MoRTH, Road Accidents in India 2023.
Buses are the network most cities need now
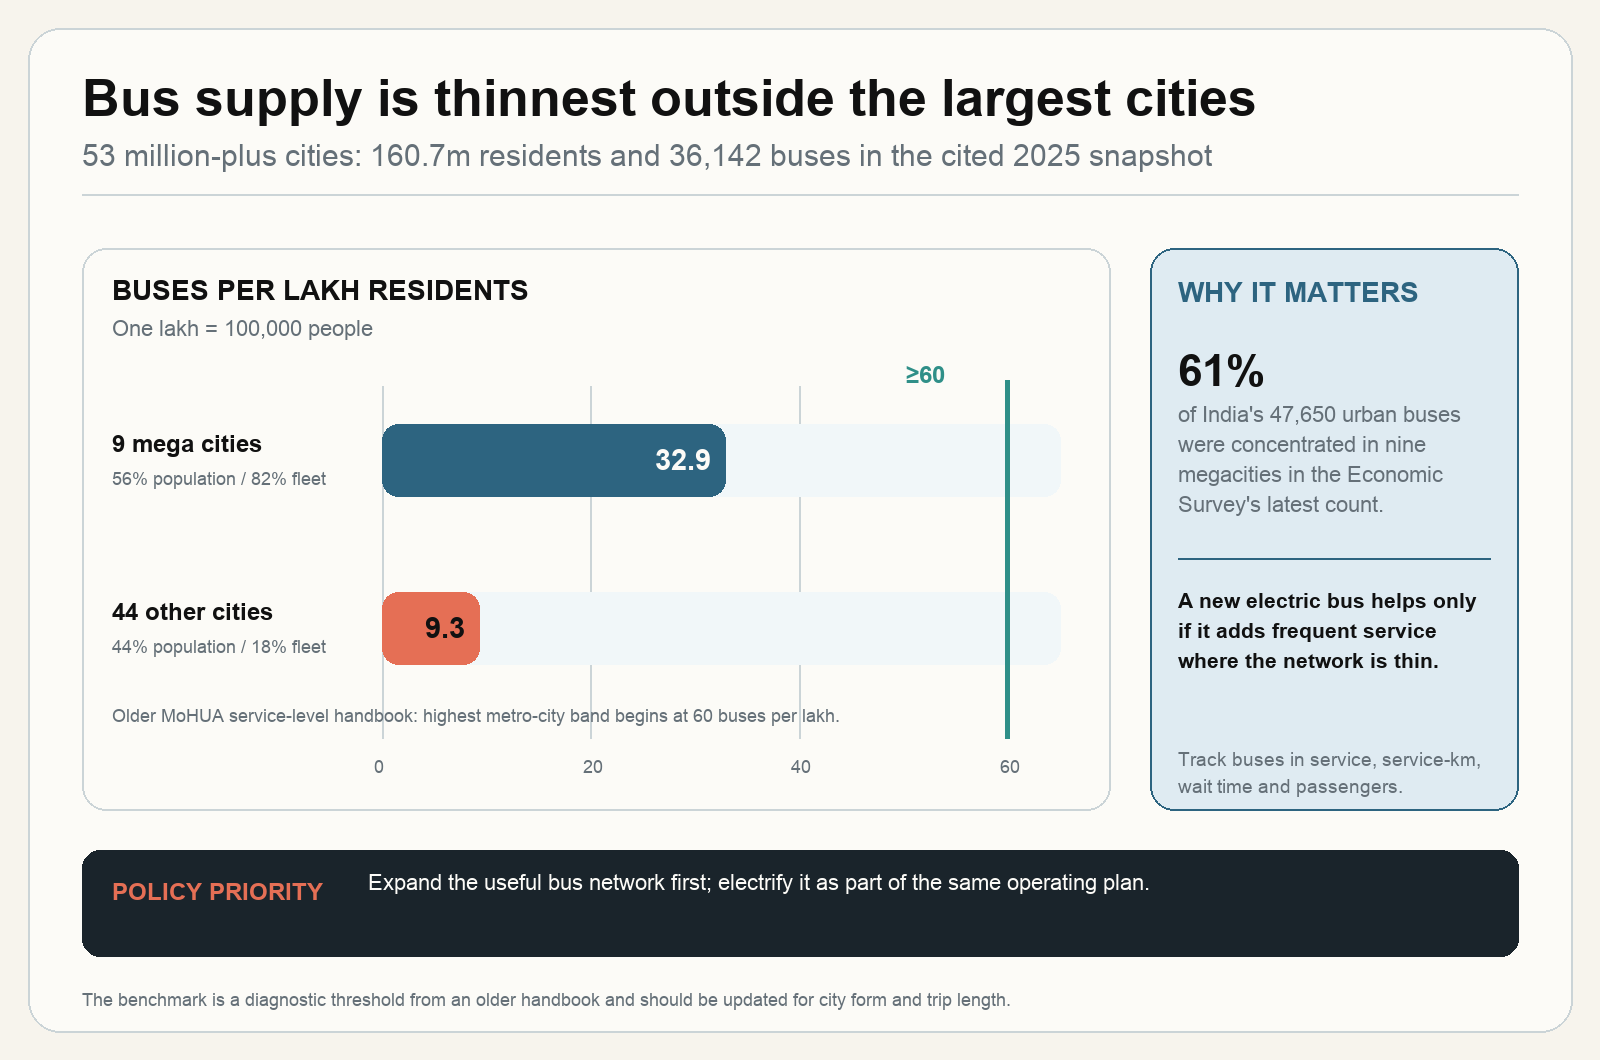
Metro can carry very large passenger volumes along dense corridors. Buses provide the connective tissue: they cover more streets, change routes more easily, serve late or dispersed demand and feed rail. Yet supply is uneven. In a 2025 Urban Mobility India presentation covering 53 cities with greater than 1 million citizens, 36,142 buses served 160.7 million people. Nine megacities held 82% of that fleet while accounting for 56% of the population. The other 44 cities averaged only 9.3 buses per lakh residents, compared with 32.9 in the megacities.
Electric buses can improve air quality, reduce noise and lower operating emissions as the power system becomes cleaner. India’s payment-security mechanisms and aggregated procurement are important because they reduce two practical risks: high upfront cost and fear that operators will be paid late. But electrification does not automatically create a more useful bus service. It changes the vehicle, the depot, the charger, the electricity connection, the maintenance skills and sometimes the schedule. All of those pieces must be ready together.
The delivery pipeline makes the distinction visible. On 10 July 2026, the PM-eBus portal showed 10,000 buses sanctioned, 6,228 confirmed, letters of award for 5,647 and concession agreements for 4,330. Four cities had launched initial services in February. Separately, 13,800 buses had been allocated under PM E-DRIVE, but an official snapshot said none had been deployed as of 12 March 2026.
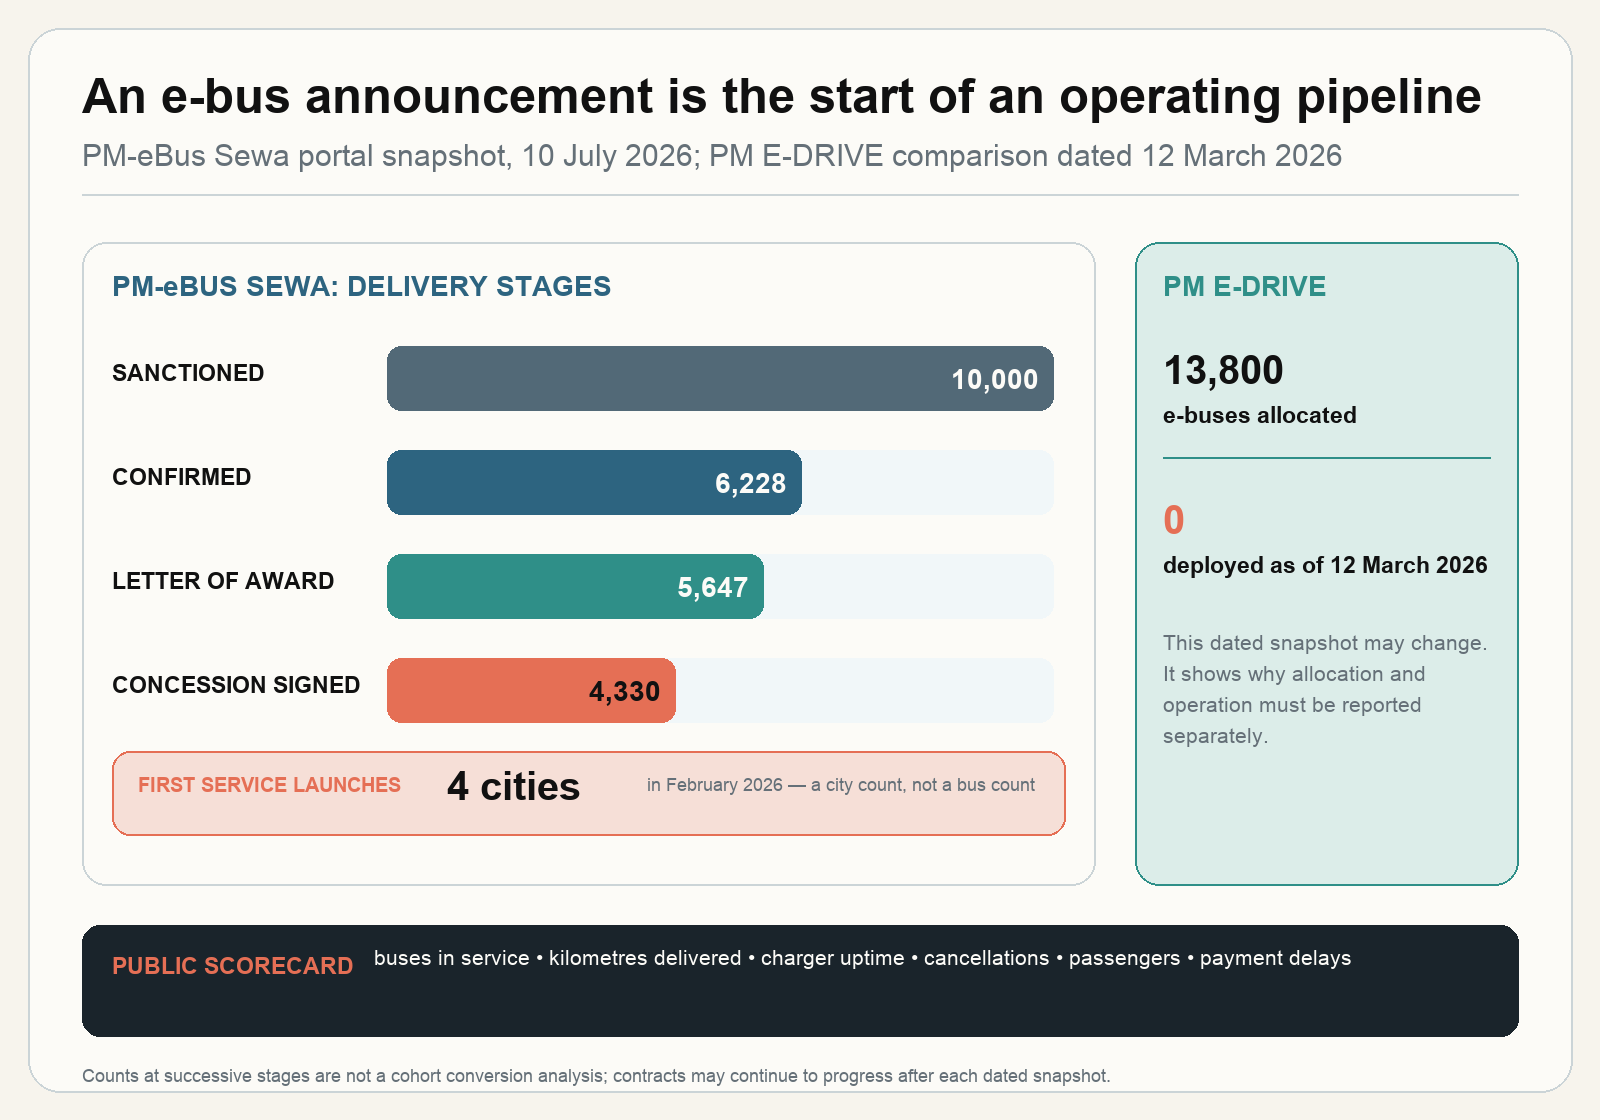
A service kilometre is one kilometre that a bus actually operates for passengers. It is more useful than a vehicle count because it combines fleet availability with operations. For full fleet intel and network optimization, a city also needs the percentage of scheduled kilometres delivered, average wait and its variability, passenger load, commercial speed, accessible journeys, complaints, energy use and the share of time chargers are available. Payment should follow verified service, with deductions or bonuses tied to reliability and passenger outcomes rather than vehicle presence alone.
International experience reinforces the systems view. The World Bank’s Shenzhen case study describes bus electrification as a package covering vehicles, charging, operations, users and financial sustainability. Bogotá separates long-lived fleet and charging contracts from shorter operating contracts, allowing different parties to carry asset and service risks. India can adapt that division where it improves financing, but the public authority must remain the integrator. It should contract battery health and energy availability separately from service kilometres, regularity, crowding and passenger satisfaction.
The missing data can be as revealing as the vehicles. Bogotá reported 1,486 electric buses in a 10,559-bus system in June 2024 and more than four million daily trips across the full TransMilenio network. The public material did not provide a clean electric-bus-only passenger or delivered-kilometre series. India should avoid the same ambiguity by linking every bus, route, charger, scheduled trip and payment to common identifiers. Sources: World Bank on Bogotá’s e-bus model and World Bank on Shenzhen.
Street management remains part of the operating model. An electric bus stuck in mixed traffic is quiet and cleaner at the tailpipe, but is still slow and unreliable. Bus lanes, signal priority, disciplined kerb space, parking enforcement and demand management can improve the service delivered by every bus. The Economic Survey’s call for parking management and congestion pricing where road geometry is binding should therefore be read as public-transport policy, not only traffic policy.
Stations need neighbourhoods
Transit-oriented development, or TOD, means putting more homes, jobs and daily services within an easy walk of high-capacity public transport - and designing the area so that walking, cycling and transfers are safe and direct. India’s national TOD policy generally treats 500 to 800 metres around a station as the influence zone. It promotes mixed land use, smaller connected blocks, reduced parking, affordable housing and universal access.
The policy direction is already present. The Metro Rail Policy 2017 requires feeder systems and walking, cycling and paratransit arrangements across a station catchment extending at least five kilometres. It also requires states seeking central assistance to commit to value capture. Footpaths, crossings, shade, drainage, bus stops, shared-mobility bays, wayfinding, public space and accessible entrances must be designed and funded as one station-access programme.
Value capture means recovering part of the increase in land or property value created by public investment. India’s framework lists tools such as betterment levies, development charges, premium floor area, transferable development rights and land pooling. A defined share should be ring-fenced for the transit asset, local walking and cycling links, feeder operations and affordable housing. Sources: National TOD Policy and Value Capture Finance framework.
London and Hong Kong show two different approaches. London expects the Greater London Authority to contribute around £7.0 billion to the Elizabeth line through a supplement on larger business properties and developer contributions. The rate, threshold, reliefs and end date are public; fewer than 14% of business and non-domestic premises were forecast to pay the supplement in 2026-27. Hong Kong’s MTR combines rail with property development. In 2024, post-tax property-development profit was HK$10.265 billion, compared with HK$7.210 billion from recurrent businesses. MTR itself noted that much of the development profit was one-off and came from projects begun years earlier.
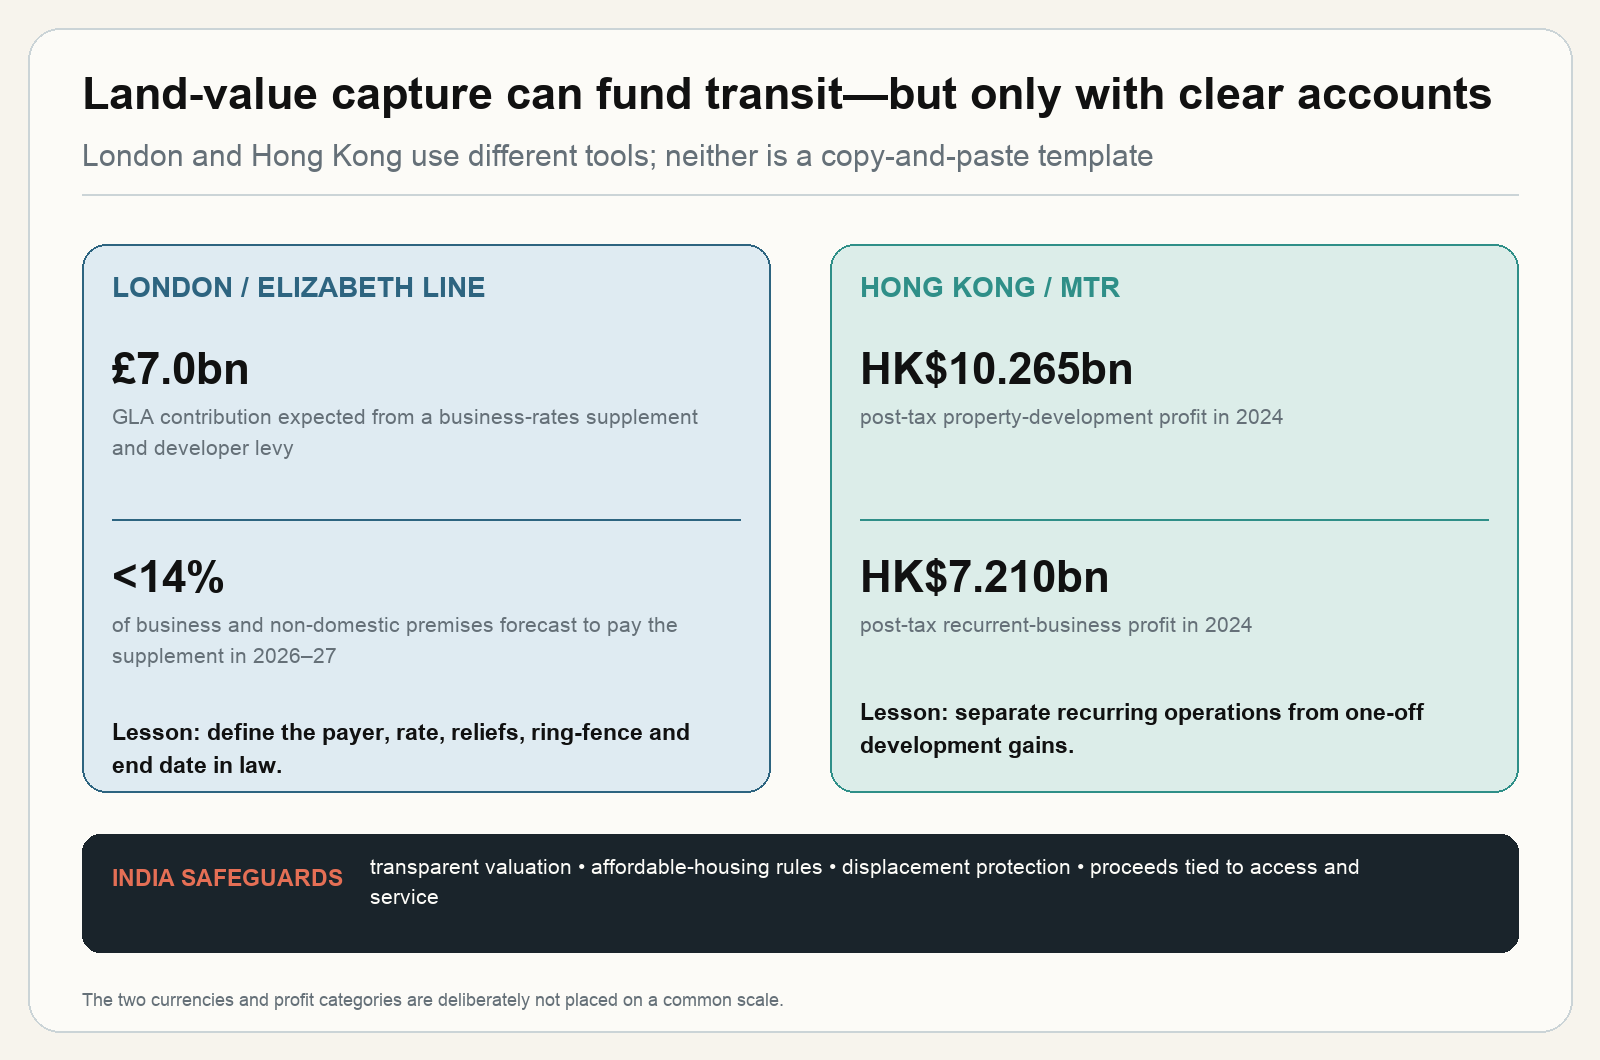
India should borrow the discipline. London depends on a broad tax base and a legal levy. Hong Kong depends on public land control, very high density and valuable property markets. Indian cities need transparent pre-project valuations, independent audits, affordable-housing requirements and protection against displacement. Land gains created by public investment should improve access for existing residents rather than price them out of the station area.
One authority must own the whole journey
Urban mobility is usually divided among a municipal corporation, traffic police, road agency, metro company, bus undertaking, development authority, state transport department and private operators. Each organisation can optimise its own part while passengers continue to experience the gaps between them. A Unified Metropolitan Transport Authority, or UMTA, is intended to provide one metropolitan view across modes and administrative boundaries.
India has recognised this institutional problem for years. The Metro Rail Policy 2017 requires state governments seeking central assistance for metro projects to commit to establishing and operationalising an UMTA within one year. MoHUA’s UMTA operations guidance similarly describes the need for an umbrella institution because separate laws, agencies and budgets frequently obstruct integrated transport decisions.
Implementation, however, remains uneven. In its April 2025 report on the Regional Rapid Transit System, Parliament’s Standing Committee on Housing and Urban Affairs noted that Delhi and Uttar Pradesh had not established UMTAs even though metro and RRTS projects were under implementation. It recommended that MoHUA take up the matter with both governments and persuade them to operationalise the authorities at the earliest. See Recommendation No. 4 in the Standing Committee’s Fifth Report.
The concern appeared again in Lok Sabha Unstarred Question No. 3177, answered on 18 December 2025. The question asked why the proposed UMTA for Tiruchirappalli had reportedly remained non-functional for several years and whether the Union government would help revive and operationalise it. MoHUA replied that urban transport is a state subject and that responsibility for establishing and executing an UMTA rests with the respective city, state or Union Territory. It pointed to the national policy, operating guidance and draft UMTA legislation already circulated.
Formally announcing an UMTA is not enough. It needs statutory authority, professional staff, a dependable budget, access to transport and land-use data, and the power to coordinate investments and service standards across agencies. Its performance should ultimately be measured through the passenger’s experience: shorter transfers, coordinated timetables, integrated fares, safer walking access and more reliable door-to-door journeys.
London offers one institutional model. Transport for London determines bus routes, frequency, capacity, fares and standards while private companies operate services through competitive contracts. Reliability bonuses and deductions use measures such as excess wait time and on-time performance. TfL also publishes route-level kilometres, speeds, reliability, complaints and customer satisfaction. India’s UMTAs could similarly control network design and data while using public or private operators according to local conditions.
Seoul demonstrates why fare integration is governance, and not only a smart card. Its 2004 reform introduced distance-based fares across bus and subway, allowed up to five transfers without another base fare, pooled bus revenues and gave the city route-planning control while private firms continued to operate. Bus lanes, route redesign, common data and performance-linked payment were launched as part of the same package. Bus ridership rose 14% in 2005; reported satisfaction rose from 14.2% before reform to 36.9% after, and peak bus speed increased by about 30% on average. Because the reforms arrived together, those observed changes cannot be reasonably be assigned to the fare rule alone, but the evidence is certainly directional.
Singapore makes the outcome itself explicit. Its 2040 plan aims for every trip to the nearest neighbourhood centre by public, active or shared modes to take less than 20 minutes; nine in ten peak-period journeys by those modes to take less than 45 minutes; and those modes to account for nine in ten peak journeys.
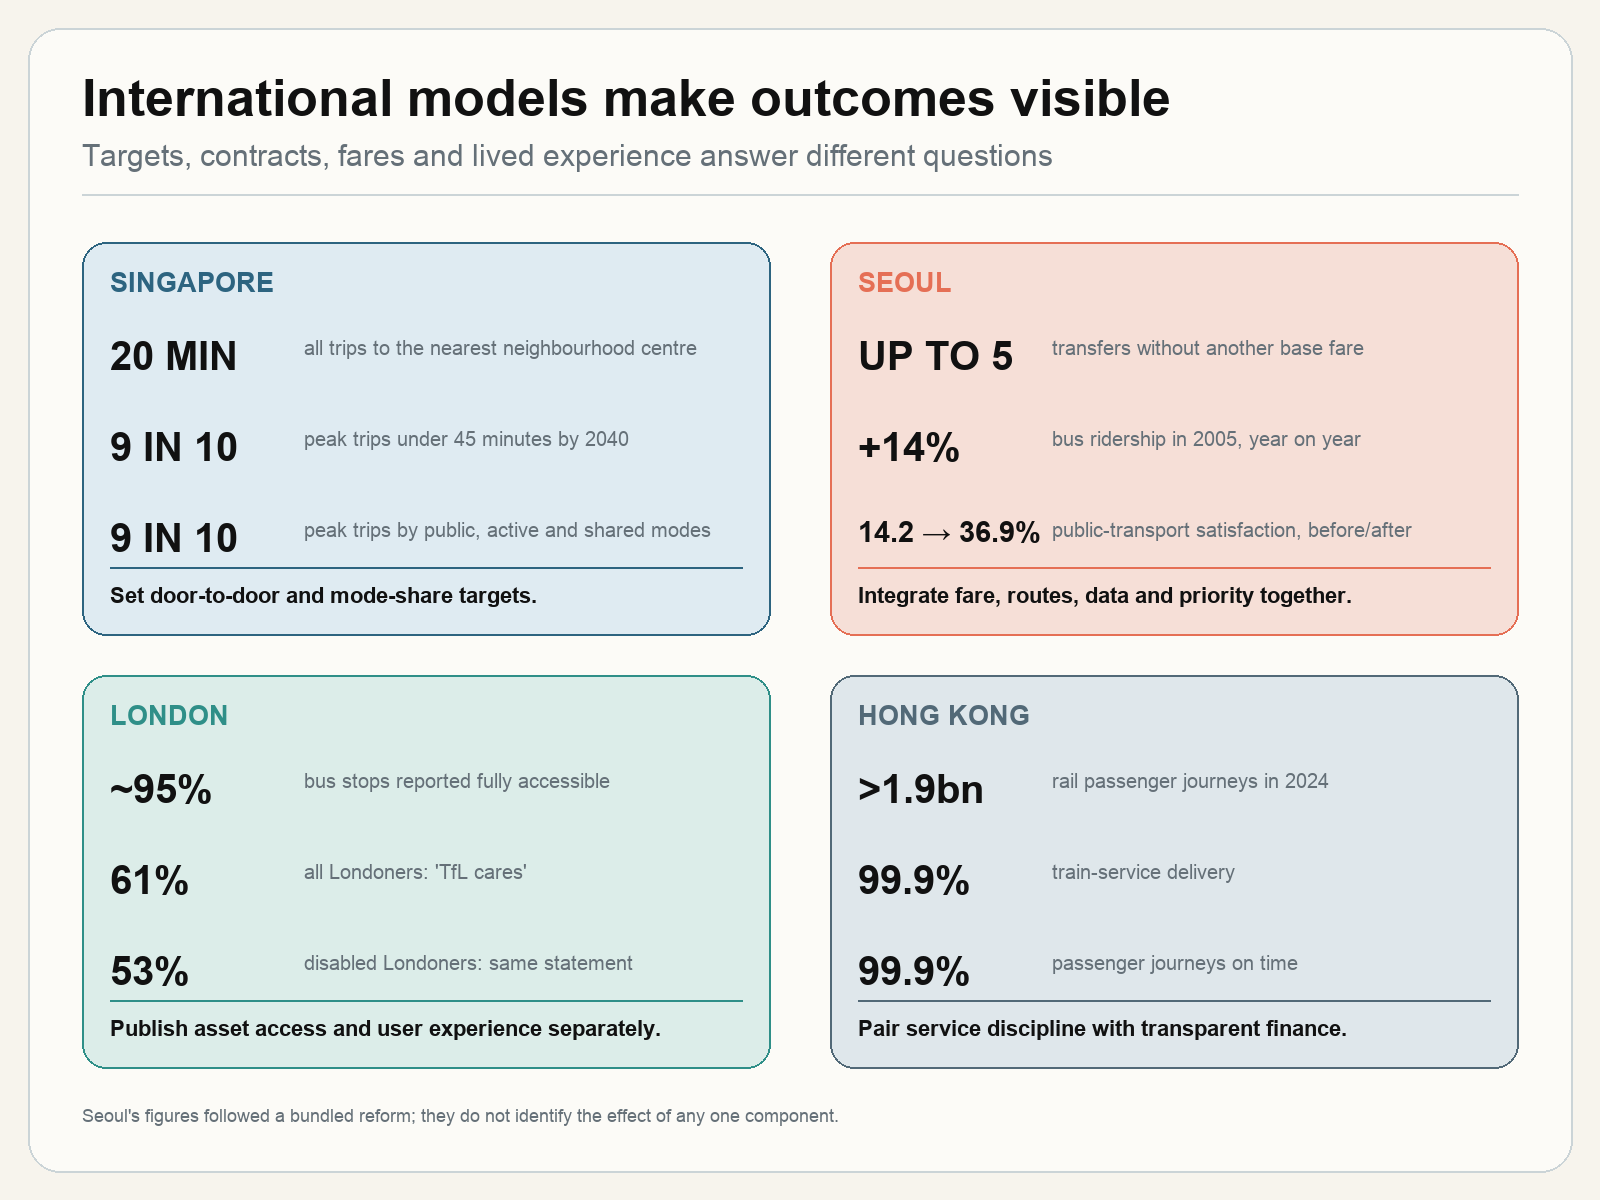
London’s experience also warns against equating an accessible asset with an equal experience. Around 95% of bus stops were reported fully accessible, yet in a 2024 survey 61% of all Londoners and 53% of disabled Londoners agreed that TfL cared about its customers. India should publish comparable gaps instead of a single average. A city can meet an engineering standard and still leave a group with a worse journey.
India already has the beginnings of an outcome framework
India does not need to invent every indicator. MoHUA’s service-level benchmark system covers public-transport availability, waiting time, operating speed, pedestrian and cycling networks, information systems, safety, pollution, land-use integration and financial sustainability. Its highest bands include at least 60 public-transport vehicles per lakh in metro cities, waits of four minutes or less, operating speed of at least 20 kilometres per hour, 75% coverage for passenger information and integrated ticketing, and walking or cycling coverage of at least 50%.
The handbook is older. Some thresholds need to be recalibrated for present technology, city form and different passenger groups. Its more important contribution is structural: it measures the service around the asset. The missing step is a modern, comparable and regularly published city dashboard linked to funding and management decisions.
The scorecard should report distributions, not only averages. A median wait can hide the outer neighbourhood that receives one unreliable bus an hour. A citywide accessibility percentage can hide a broken transfer on the route to a hospital. Results should be broken down by corridor, neighbourhood, time of day, income, gender and disability.
1. Make an operational UMTA a funding condition. Central support for major projects should require a statutory metropolitan authority with a published network plan, named powers, staff, budget, data access and a process for resolving agency conflicts.
2. Put the journey baseline in every project report. Before approval, publish current door-to-door times, wait and transfer times, total fares, safety and accessible-trip measures for the people and places the project is meant to serve. Forecasts should identify every feeder and land-use assumption.
3. Separate the delivery stages. Report sanctioned, tendered, contracted, commissioned and operating assets independently. For buses, add scheduled and delivered service kilometres, passengers, cancellations, charger uptime and payment time. For rail, add ridership against forecast, service reliability and complete-network effects.
4. Ring-fence land gains for visible access. TOD and value-capture receipts should have audited accounts and defined uses: station access, walking and cycling, feeder service, public space, affordable housing, asset renewal and debt service. Valuation and displacement safeguards should be public.
5. Review outcomes after opening. Independent one-, three- and five-year evaluations should compare the baseline, forecast and result. Funding for the next phase should respond to what was learned - completing missing links or fixing service before adding another disconnected asset.
The next kilometre should complete a journey
India’s rapid metro expansion is the capability on which the next phase can build. High-capacity rail remains essential in the right corridors. Electric buses are essential for cleaner, wider coverage. Shared mobility can fill gaps. TOD can shorten trips and help finance access. None of those tools produces a good journey on its own.
The policy change is to connect the tools through one accountable system. A passenger should be able to know when the service arrives, pay a fair total fare, transfer without friction, travel safely and reach the real destination. A city should be able to show who receives that outcome, what it costs and where the gaps remain.
Kilometres describe what India has built. Buses sanctioned describe an intention. Budgets demonstrate a capacity to act. The next test is the journey actually delivered. If that becomes the funding rule, the operating contract and the public scorecard, the next kilometre will be valuable because it completes a journey - and not simply because it extends a line on a map.
Sources & notes
1. Ministry of Finance - Economic Survey 2025-26, Chapter 15: Urbanisation
2. PIB - India’s metro network and ridership update, June 2026
3. PIB - Kolkata Metro Green Line ridership update
4. CAG - Performance Audit of Lucknow Metro, Report No. 12 of 2025
5. Urban Mobility India 2025 - Bus service levels in million-plus cities
6. MoHUA - Service Level Benchmarks for Urban Transport
7. PM-eBus Sewa - Programme portal and delivery-stage dashboard
8. PIB - PM E-DRIVE e-bus allocation and deployment snapshot, March 2026
9. MoHUA - Metro Rail Policy 2017
10. MoHUA - National Transit Oriented Development Policy
11. MoHUA - Value Capture Finance Policy Framework
12. MoHUA - Operations Document for Unified Metropolitan Transport Authority
13. Parliamentary Standing Committee - Urban transport and UMTA implementation, December 2025
14. Singapore Land Transport Authority - Land Transport Master Plan 2040
15. Transport for London - London bus tendering and contracting, 2025
16. Transport for London - Bus performance data
17. Seoul Metropolitan Government - Integrated Transfer and Distance-based Fare System
18. London City Hall - Funding the Elizabeth line through the business-rate supplement
19. MTR Corporation - 2024 annual results and Rail plus Property model
20. World Bank - Electric-bus contract model in Bogotá
21. World Bank - Electrification of Public Transport: Shenzhen Bus Group